
Log File To Google Map with Python
Opening up a computer to the world exposes it to a plethora of bots scanning for default credentials, unpatched vulnerabilities, among other things. It’s important to take this into consideration when configuring a publicly facing service. Key exchange or a strong password, access control, and keeping on top of updates are a must. When I first got to campus which has a mostly public facing network, I was amazed at the number of bots constantly scanning everything and anything.
I first noticed this when randomly checking my SSH access log file. There was a long list of failed attempts from a multitude of strange IP addresses. After making sure my SSH configuration was locked down by using keys and not allowing root login, I decided to collect some information about these bots. The result is this application that will take any file containing IP addresses and output an HTML file with an interactive map using the Google Maps API.
Note, although logged SSH connections are used as the example in this post, any file containing IP addresses can be analyzed.
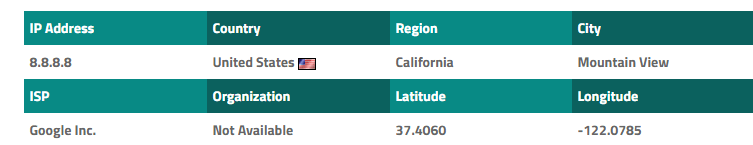
As a security student, I love the blue team’s responsibility of collecting and analyzing information. As a homelabber, dashboards, graphs, and charts are some of my favorite things to create so I can monitor my machines and network. An IP address doesn’t reveal much about the computer or user behind it, but the GeoIP database can at least show where the connection came from. This is where I decided to start.
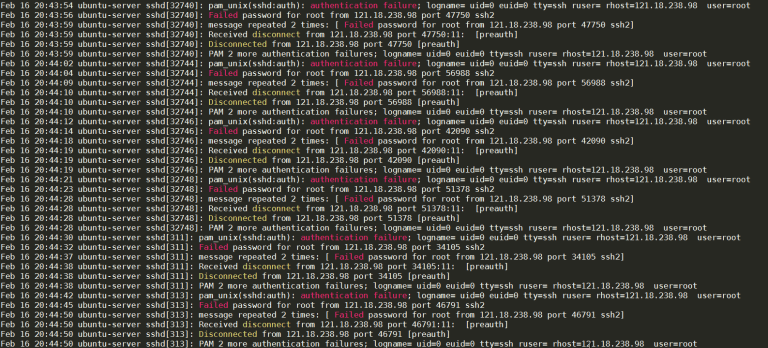
The first step was to filter the log file down to only IP addresses. Regex makes this easy. There are plenty of expressions for IP addresses. The one I used is [0-9]+(?:\.[0-9]+){3}. After getting a list of IP addresses, we need to run them through the database to get the location data. There are a plethora of API’s and online services to do this. At first I tried to parse iplocation.net which turned out to be a mess because of the multiple tables. [freegeoip.net]”https://freegeoip.net”) is a better option because it only returns the location information in JSON, XML, or CSV format.

With the gmplot library, only the latitudes and longitudes are required. The scatter map can place markers at each location, but there is also a heat map option. I am currently adding to gmplot by appending labels to a marker so that the IP address or number of attempts are shown. Finally, an HTML container displays the total number of unique IP addresses and countries of connections from the past hour. The script is run hourly via a cron job. New addresses are looked up and a new map is made.
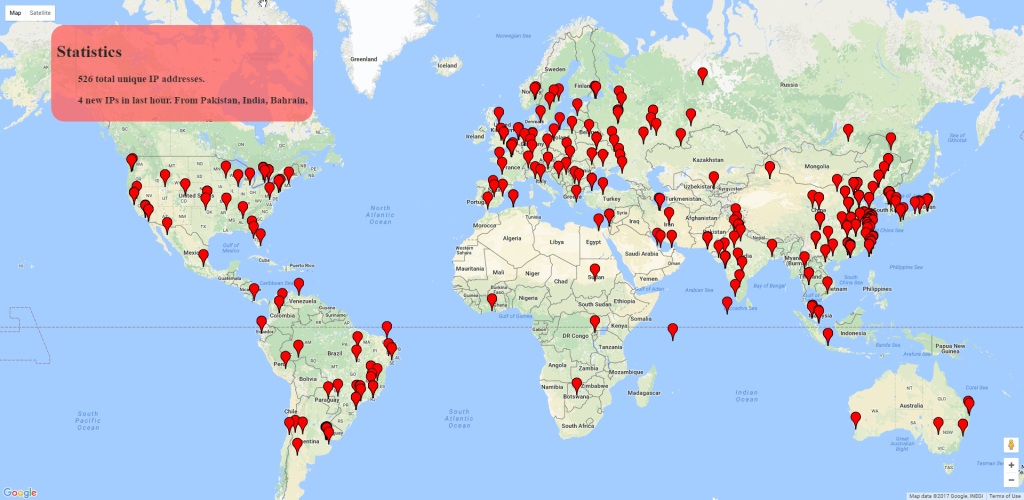
This project started in late January, and was stopped at the end of the spring semester in May. The final number of unique IP addresses is over 4500 from all over the world. At first, most connections originated from China, but slowly other places around the world started popping up. For a week, a large number of South American IP addresses were connecting.
For the Future
This script was programmed quickly and then constantly revised. Addresses are saved in a text file after being processed. If I were to start over, a database using the sqlite3 python module or other database system would open up the possibility for more features like sorting or filtering. The GeoIP database is available to download which would save time by cutting out HTTP requests. Since this process runs in the background and saves addresses, saving 15 seconds is not a major improvement. Getting more information about the hosts through Nmap scans and other lookups would create more useful analyses. Finally, a page dedicated to statistics can serve as a visualization for the deeper analysis.
This is very much a work in progress as being off campus and other projects have halted my work. Getting this far has already been a very useful learning tool for incident response, information analysis, python, and scripting. I would love to eventually add the features above and create my own log analysis tool or add it to a honeypot environment.