
Diving into the Deep End - Sinkholing an Active Botnet
I’m not an expert in reverse engineering or threat intelligence. I spend my days as a security analyst trying to make sense of things I don’t know much about. Those things might be a system admin setting up a new application or it could be a multi-stage malware attack. In one case it was the latter.
I’m not an expert but I do love to learn. When I saw that the malware I found was an emerging threat and a domain it used wasn’t registered, I jumped on it.
By The Numbers
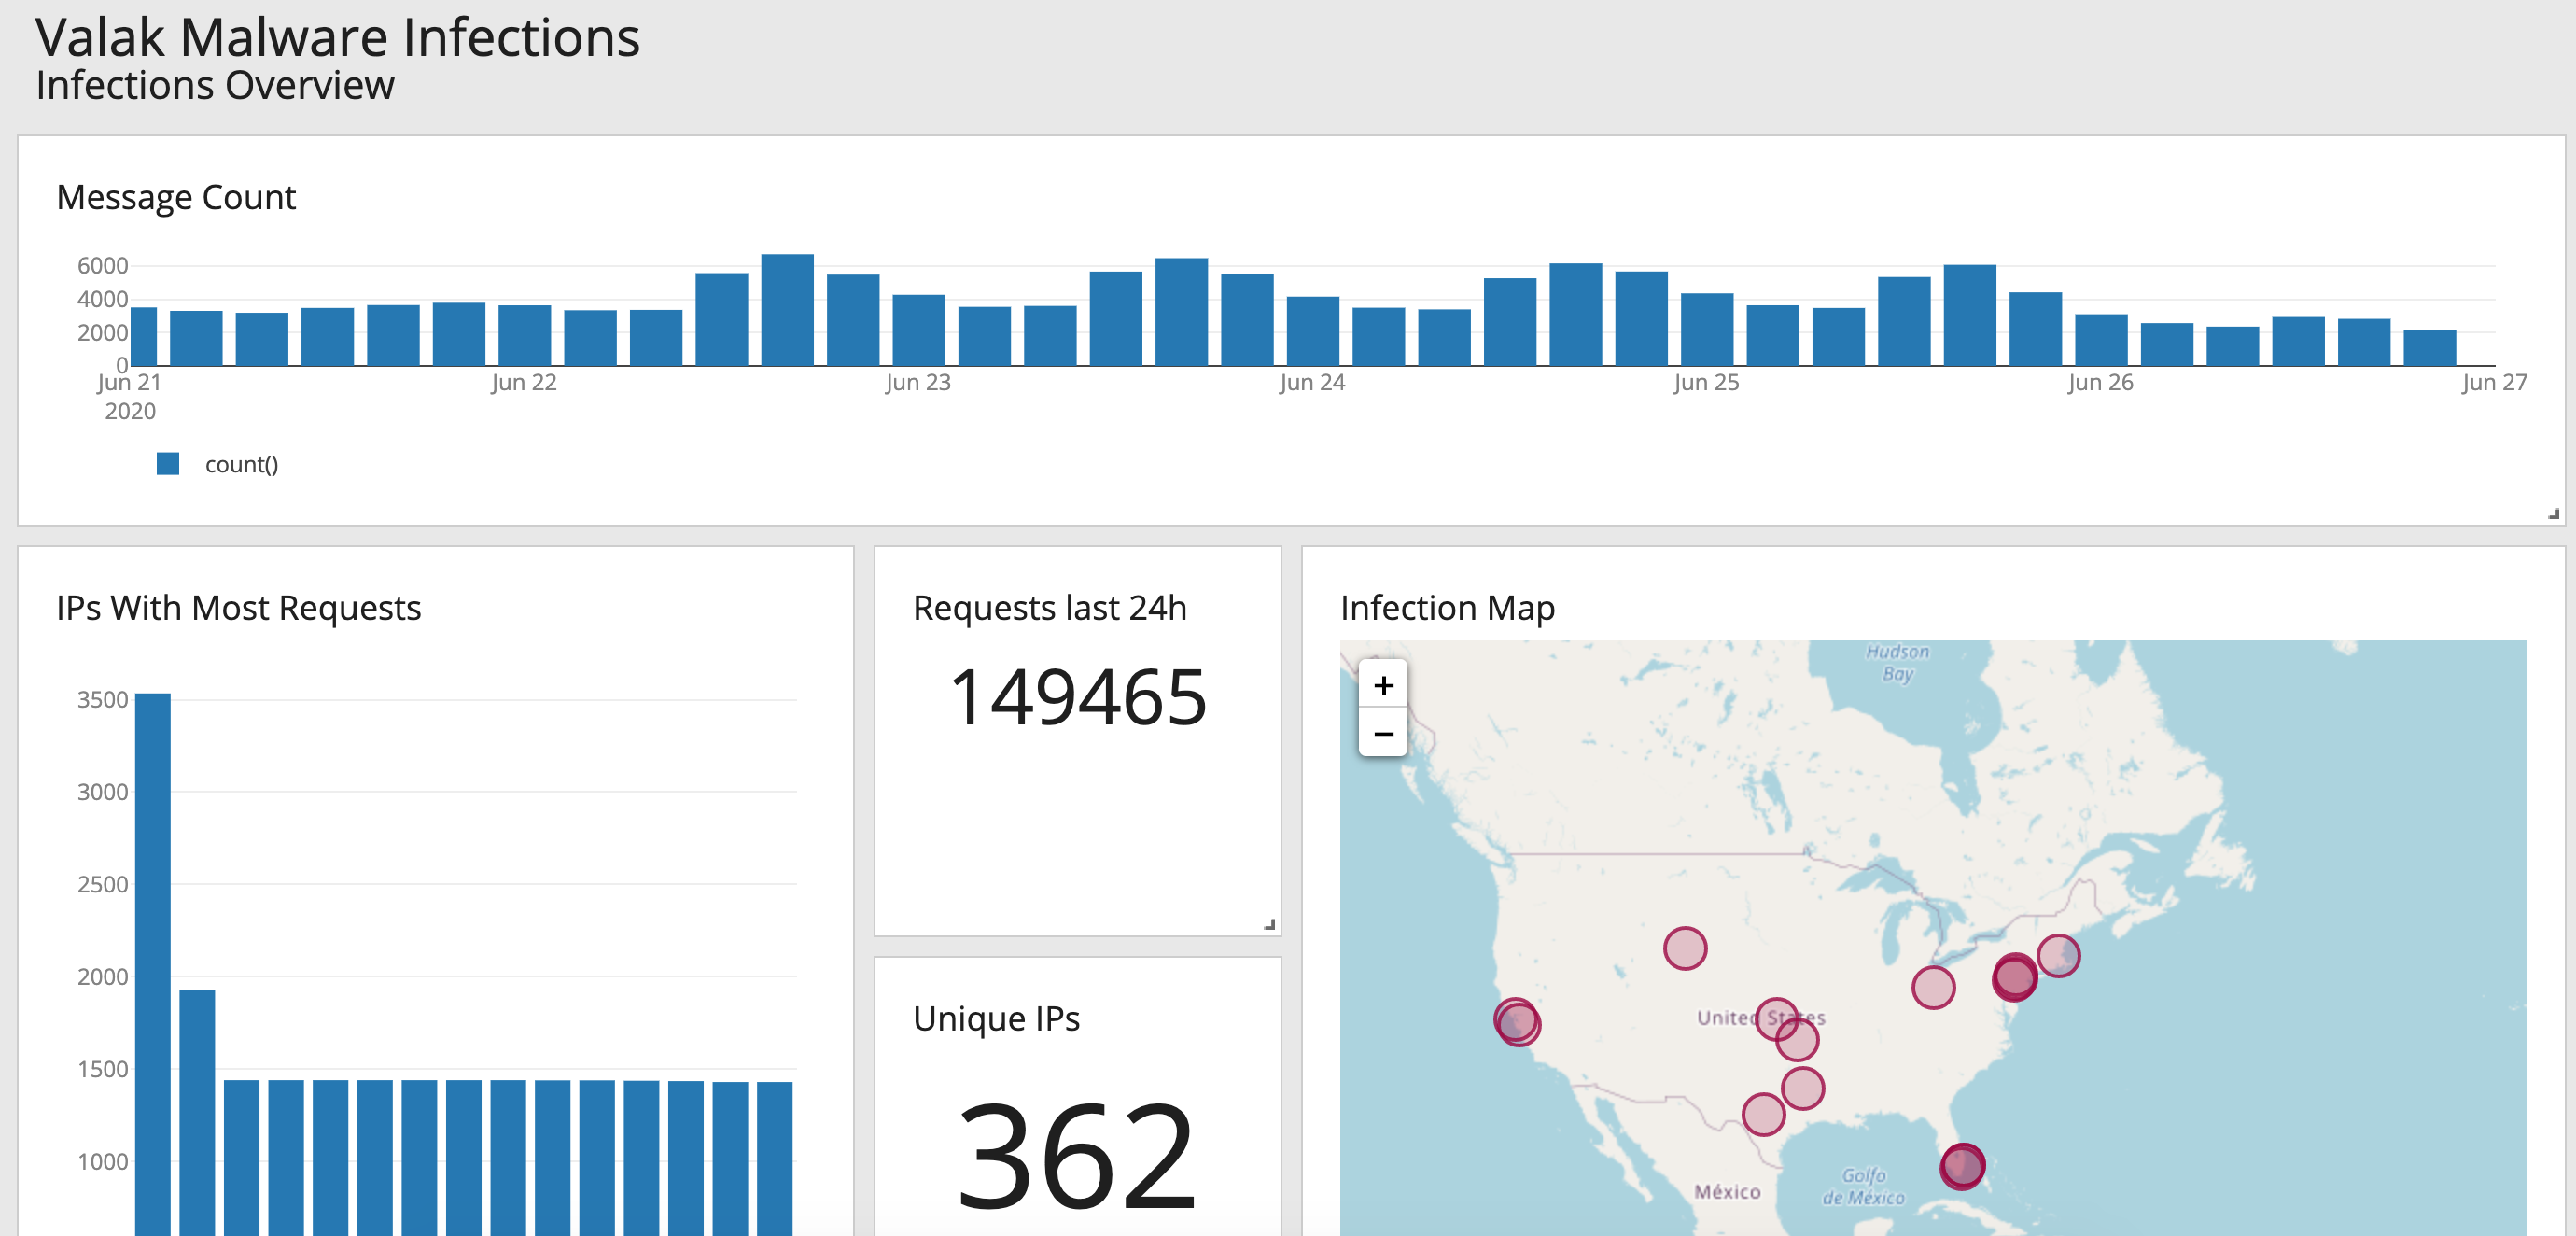
Spoiler alert! Here are the results after 3 months.
7,500-15,000 requests a day.
912 IP addresses.
92 ASNs.
Setup
There isn’t much to this part. I bought the domain for $12. I spun up a server in AWS. While NGINX installed I made a DNS record. Before I could take a breath I was a real threat researcher.
That’s easy enough, but what can you do with lines and lines of HTTP requests in a file? Luckily I already had a Graylog server running. Getting NGINX logs into it took a little time but it was well worth the effort as it transformed what was just text into a beautiful command center.
Analysis
After the logs started flowing I could start to visualize the data. I’ll be honest, the raw logs aren’t that interesting. The C2 script checks in with a GET request to /api.aspx with a few encoded parameters. I added extractors to the stream for GeoIP and ASN data.
You know that first room in Willie Wonka’s chocolate factory? The one with the chocolate river and everything is made out of candy? I felt like I was touring it when I started making different charts and graphs.
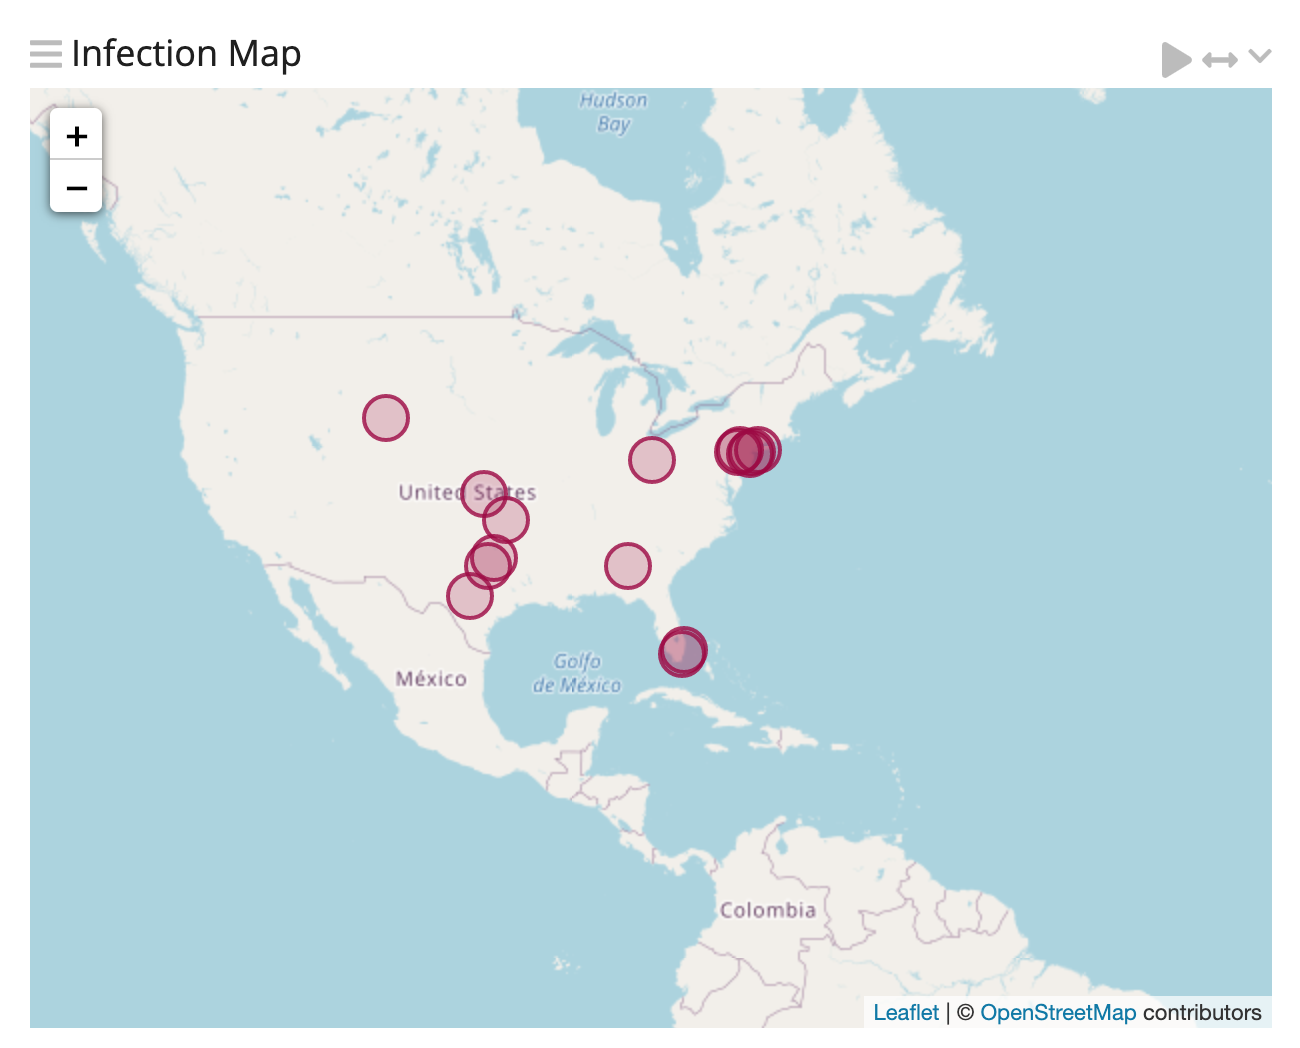
Geography
The first thing I noticed is that this campaign targeted the US. After three months I have yet to receive a request from another country. These results are (mostly) in line with the Cybereason report from May 2020 stating Valak specifically targets enterprises in the US and Germany. Again, I only saw US activity.
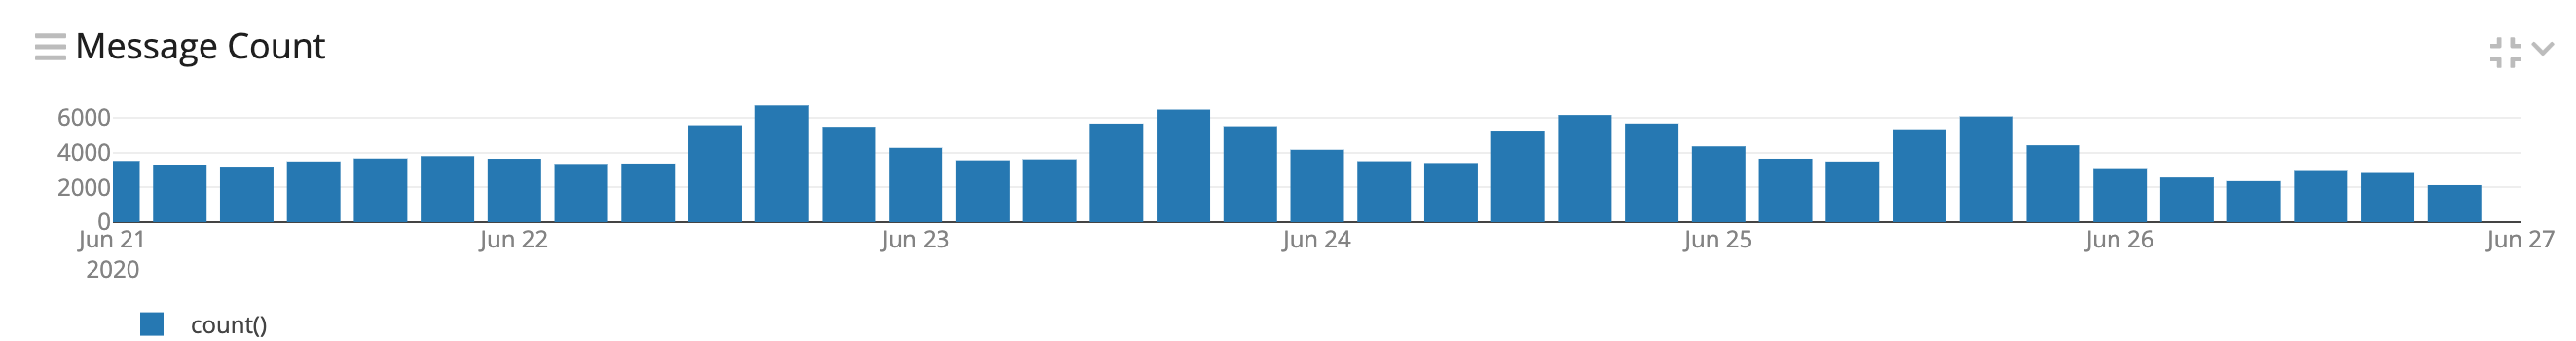
Attack Vector
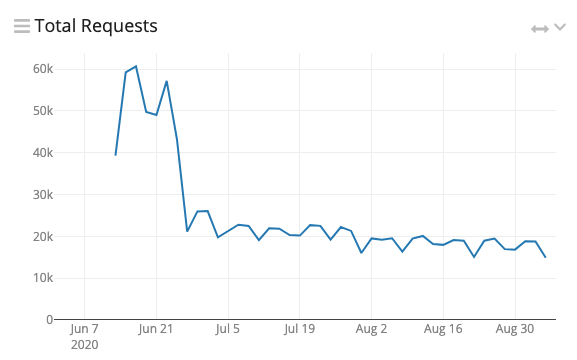
Speaking of enterprises, Valak infects employee workstations using phishing. This can be seen in the data. The most requests happen during weekdays rising starting at 8am EST and falling around 5pm — corresponding with when work laptops are turned on and off. If servers were infected we’d expect the script to be calling back 24/7.
Persistence
The C2 script calls out every 6 minutes. This can also be seen in the data. Except in the case of multiple infections, IP addresses will show exactly 10 requests sent every hour.
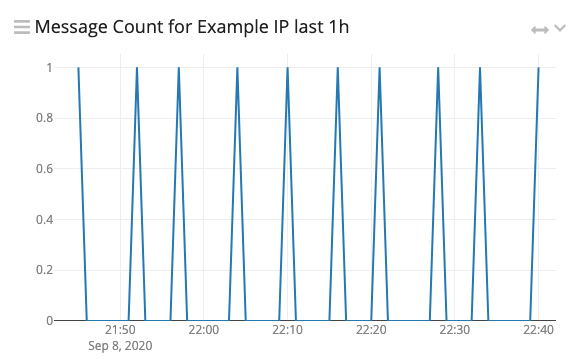
Regular intervals indicate a scheduled task.
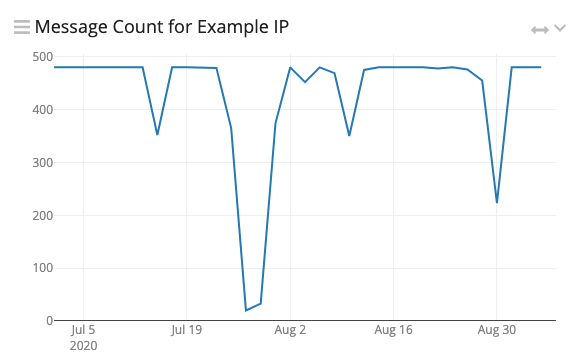
It's good to see someone taking PTO!
Researcher Interest
Are you in these logs? Although Valak infects workstations through phishing, there were requests from hosting providers like DigitalOcean and AWS. These could be proxies, sandboxes, or general detonation/reversing machines. Activity slowly trickled off and ended almost completely July 23rd. This could be due to new samples being found or an overall disinterest after everything has been published.
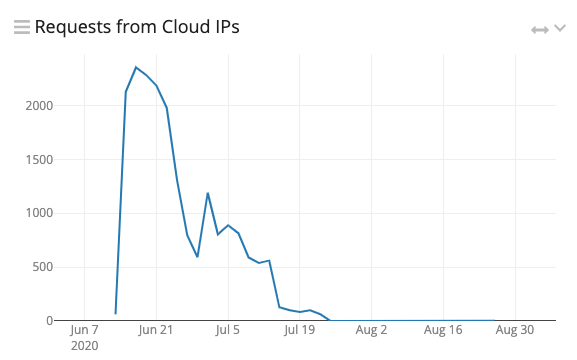
To compare, requests from everywhere else continue to come in at a steady rate.
Future Work
Dwell time, the length of time from infection to eradication, could be calculated by looking at when an IP started and stopped sending requests. I have a feeling I’ll be very disappointed.
Multiple infections at the same company could be found by looking at which IP addresses send more than 10 requests an hour.
Conclusion
This was my first serious step into threat research and malware analysis. I didn’t know what would come of purchasing a domain used by malware. Luckily it’s been a few months and I have yet to receive an abuse report from AWS. There are an overwhelming number of things to look and many different ways to expand on this setup. I’m not an expert but maybe I will be soon.