
The Technical Tricks I Learned Playing OpenSOC
As a security analyst for a major MSSP, I use the fancy expensive tools for work. OpenSOC showcases the power of some awesome open source tools that many people have never used. Here are some things I learned by having access to data that’s normally hidden behind an API or totally inaccessible and features not included in large platforms.
Contents
Sysmon
I’d always heard of Sysmon, especially SwiftOnSecurity’s sysmon config, but I never looked into what it was. Here’s an excerpt straight from the Microsoft docs.
System Monitor (Sysmon) is a Windows system service and device driver that, once installed on a system, remains resident across system reboots to monitor and log system activity to the Windows event log. It provides detailed information about process creations, network connections, and changes to file creation time.
And here I was thinking you needed costly EDR sensors to get that information. All of the details an analyst needs to investigate a typical alert is collected by the Sysmon service.
Event IDs
It’s amazing how quickly I started remembering Event IDs. Process creations, file modifications, and network connections are crucial to understanding what happened on a system. These were the events I found myself constantly searching for.
This Sysmon cheatsheet is a great graphic to show the IDs and fields for each kind of event. This appendix in the Microsoft docs also contains every Windows Event ID (the 4000 numbers below).
| Event ID | Name |
|---|---|
| 1 | Process Created |
| 3 | Network Connection |
| 8 | CreateRemoteThread (Process Injection) |
| 11 | File Created |
| 13 | Registry Modified |
| 4103 | PowerShell Activity |
| 4624 | Account Logon Success |
| 4697 | Service Created |
| 4698 | Scheduled Task Created |
Graylog
The most important thing to know is that Graylog interprets a space as an OR operator, not AND.
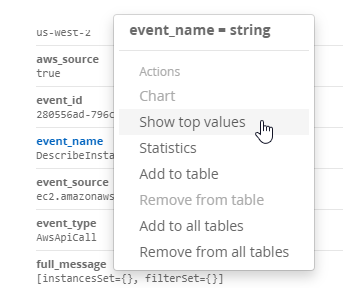
Quick Values
The Quick Values option displays all unique values for a field ranked by count along with a pie chart. This has been replaced with Show top values in Graylog v3 but it shows the same information minus the chart. I used this a lot during the competition, especially for getting a hostname from an IP address or vice versa. Searching a recent timeframe for src_ip:x.x.x.x and then looking at the top hostname values usually yielded the correct one.
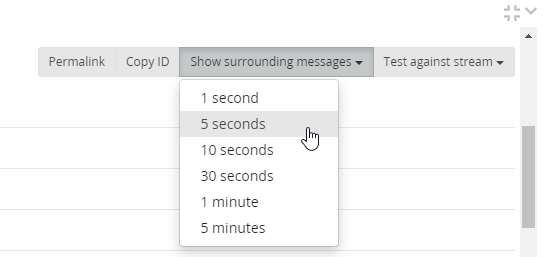
Show Surrounding Messages
When I found an interesting event, I knew the challenge answer had to be nearby. Selecting Show Surrounding Messages in an open message and choosing a time frame will show all messages from the same source.
Here’s an example. I know a malicious executable was used to do bad things. Searching for File Create events and the filename shows it was downloaded with PowerShell. Clicking Show Surrounding Messages will show the Process Create event for powershell.exe and tell me the parent process. With that information I can get an understanding of how the attacker is embed in the system. The executable may have come from a Word document and the attacker is just getting access or they’re injected into a SYSTEM level process and have already moved laterally.
The search for surrounding messages defaults to showing results from the same log source. When looking for lateral movement it may be helpful to look at all or a select few sources to view the whole picture.
_Exists_
The _exists_ field takes in another field as its value. It will only return results where the given field has a value. Basically rather than searching hostname:* you can use _exists_:hostname. I used this multiple times during OpenSOC. One especially useful time was when searching for an IDS Signature ID. Searching for _exists_:ids_sid will return all results from any IDS product.
Osquery
I’ve played with osquery a little bit before and even gave a talk about it in college, but I had never used it for a real investigation. Kolide is probably the most popular way of managing osquery for an environment but OpenSOC uses a custom front-end that connects through Salt.
A great resource to view all tables available is the Schema page. Recon Infosec’s Recon Hunt Queries contain a treasure trove of DFIR related queries.
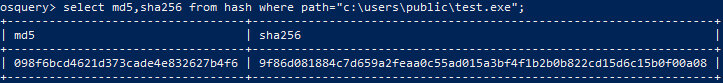
File Hashes
One of my most common needs as an analyst is to get the hash of a file that wasn’t recorded by the platform. Osquery’s hash table does just that. Give it a directory, path, or spice it up with some regex and Osquery will return the MD5, SHA1, and SHA256 hashes of the matched files.
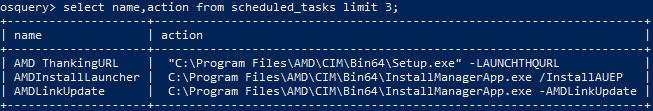
Persistence Items
There are several ways to persist on Windows. The autoexec table aggregates results from services, scheduled_tasks, startup_items, “and more”. This is a fast way to get an understanding of what persistence mechanisms are on the system. It definitely beats running individual PowerShell commands.
Conclusion
These bits of information were extremely useful for finding the needle in the haystack. Thanks to the Recon Infosec and OpenSOC teams for putting on an awesome competition. I was amazed at the quality and robustness of the tools provided and will definitely be setting up a homelab to play with them more.